Life Cycle Assessment

Understanding Carbon Footprint
Global warming potential (GWP), commonly known as a ‘carbon footprint’, measures the potential global warming impact of a process in CO2 equivalents of greenhouse gases between a defined start and end point. Different emissions can have a lesser or greater global warming impact so, for convenience, they are measured and then converted into ‘CO2 equivalents’ of greenhouse gases. For instance, one tonne of methane has the equivalent global warming impact of twenty five tonnes of carbon dioxide.
In the case of NatureFlex™, a complete Life Cycle Assessment (LCA) has been carried out from ‘Cradle to Gate’. This has allowed us to measure and understand the impacts of all our raw materials, through the whole of our manufacturing process until the finished slit reel of film is ready to leave our site. Futamura’s LCAs have all been carried out by Sphera (previously Thinkstep), or ERM, using the GaBi software.
It is increasingly common for companies to seek to compare the carbon footprints of different materials, however, great care must be taken to ensure that the comparisons are made only between materials with similar functional properties, using the same LCA methodologies and assumptions, with the same start and end points.
The graph shown below compares the carbon footprint (kg CO2eq / kg) of three conventional plastic films; polyester (PET), polypropylene (BOPP) and polyamide (PA6) – together with the current carbon footprint of lacquered NatureFlex™ NVS film. It also includes a projected carbon footprint for lacquered NatureFlex™ in 2027/28, based on planned improvements to our manufacturing process.
NatureFlex™ is similar to polypropylene, but in terms of density, mechanical properties, printability and heat resistance, polyester is the closest comparative film. NatureFlex™ is also a good alternative for polyamide film as NatureFlex™ has a very good oxygen barrier and a similar stiffness.

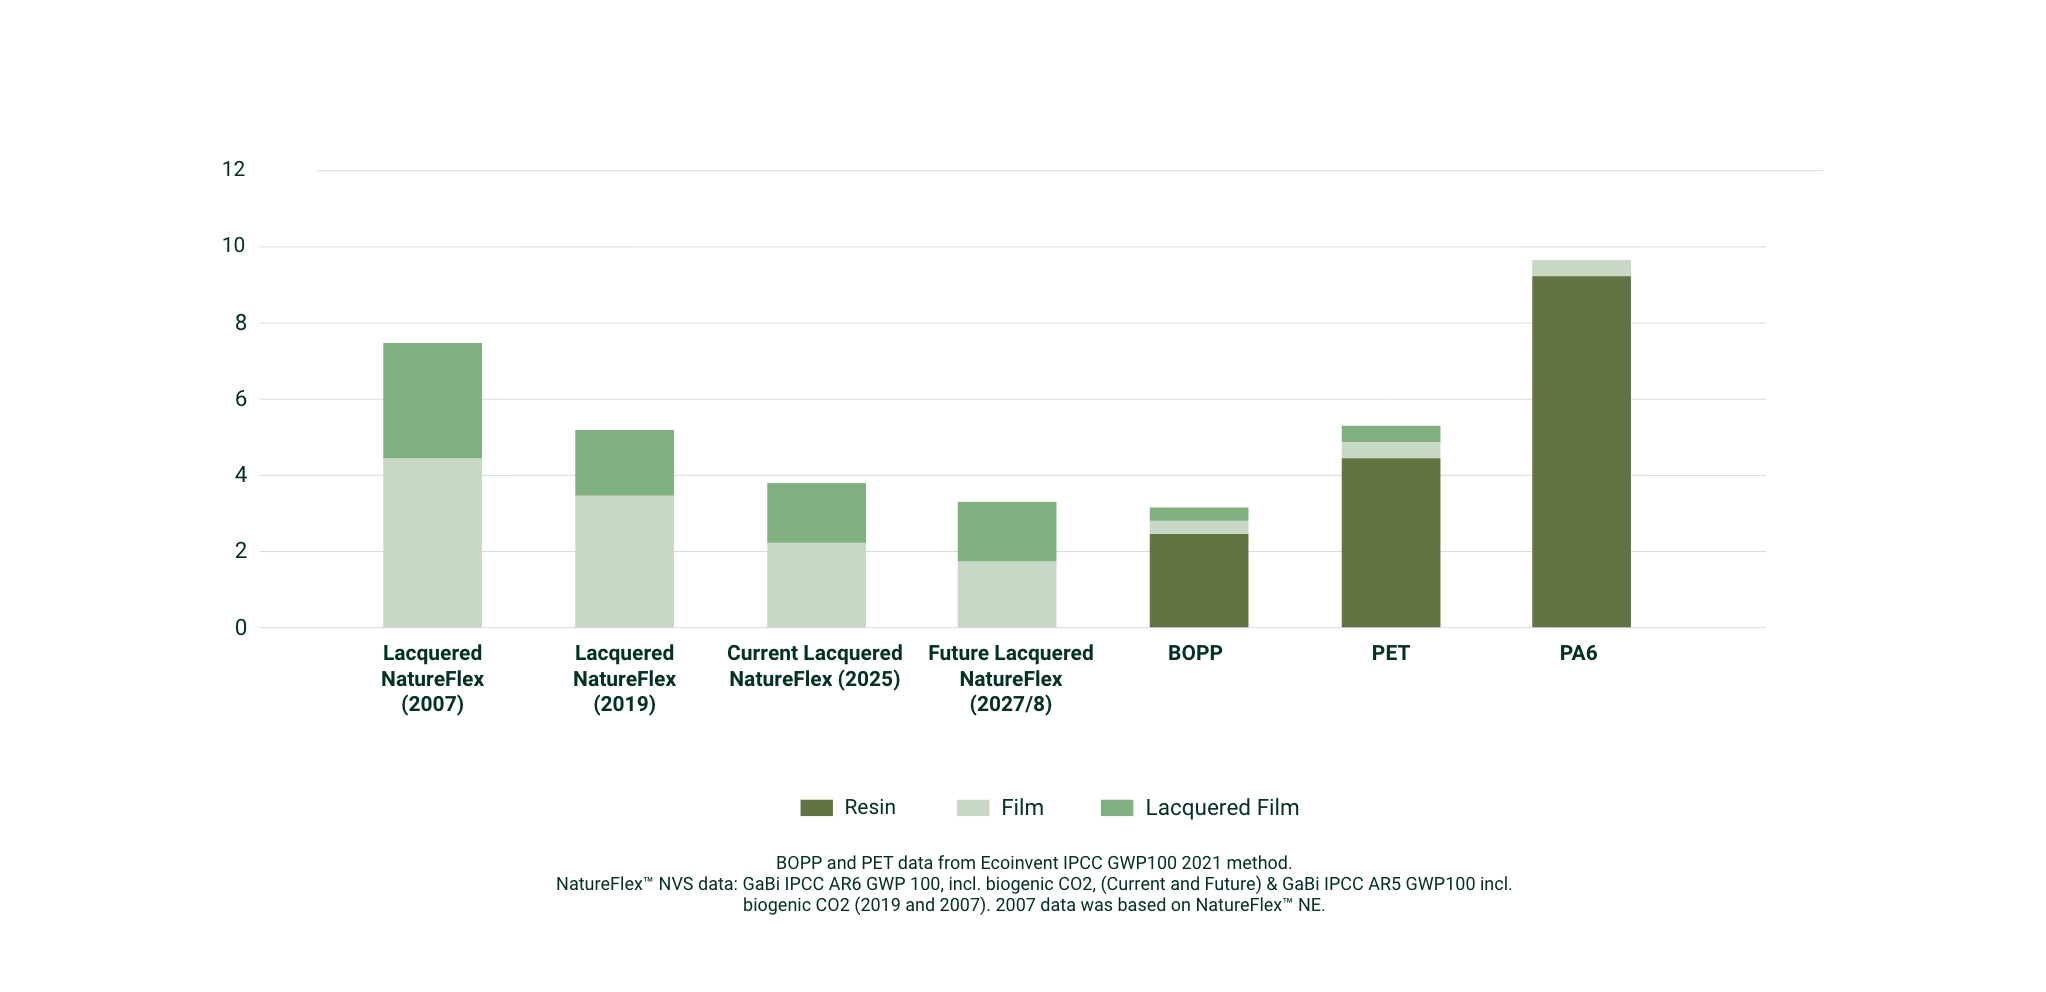
One key investment driving our future carbon footprint reduction is the installation of a Wet Sulfuric Acid (WSA) Process at our UK site. This has been supported by an Industrial Energy Transformation Fund (IETF) grant which was awarded to Futamura by the UK Government in 2025. The WSA Process will significantly reduce our sulphur-based emissions and generate substantial energy for on-site use, thereby reducing our dependence on natural gas and cutting our carbon footprint.

Understanding Impact Categories
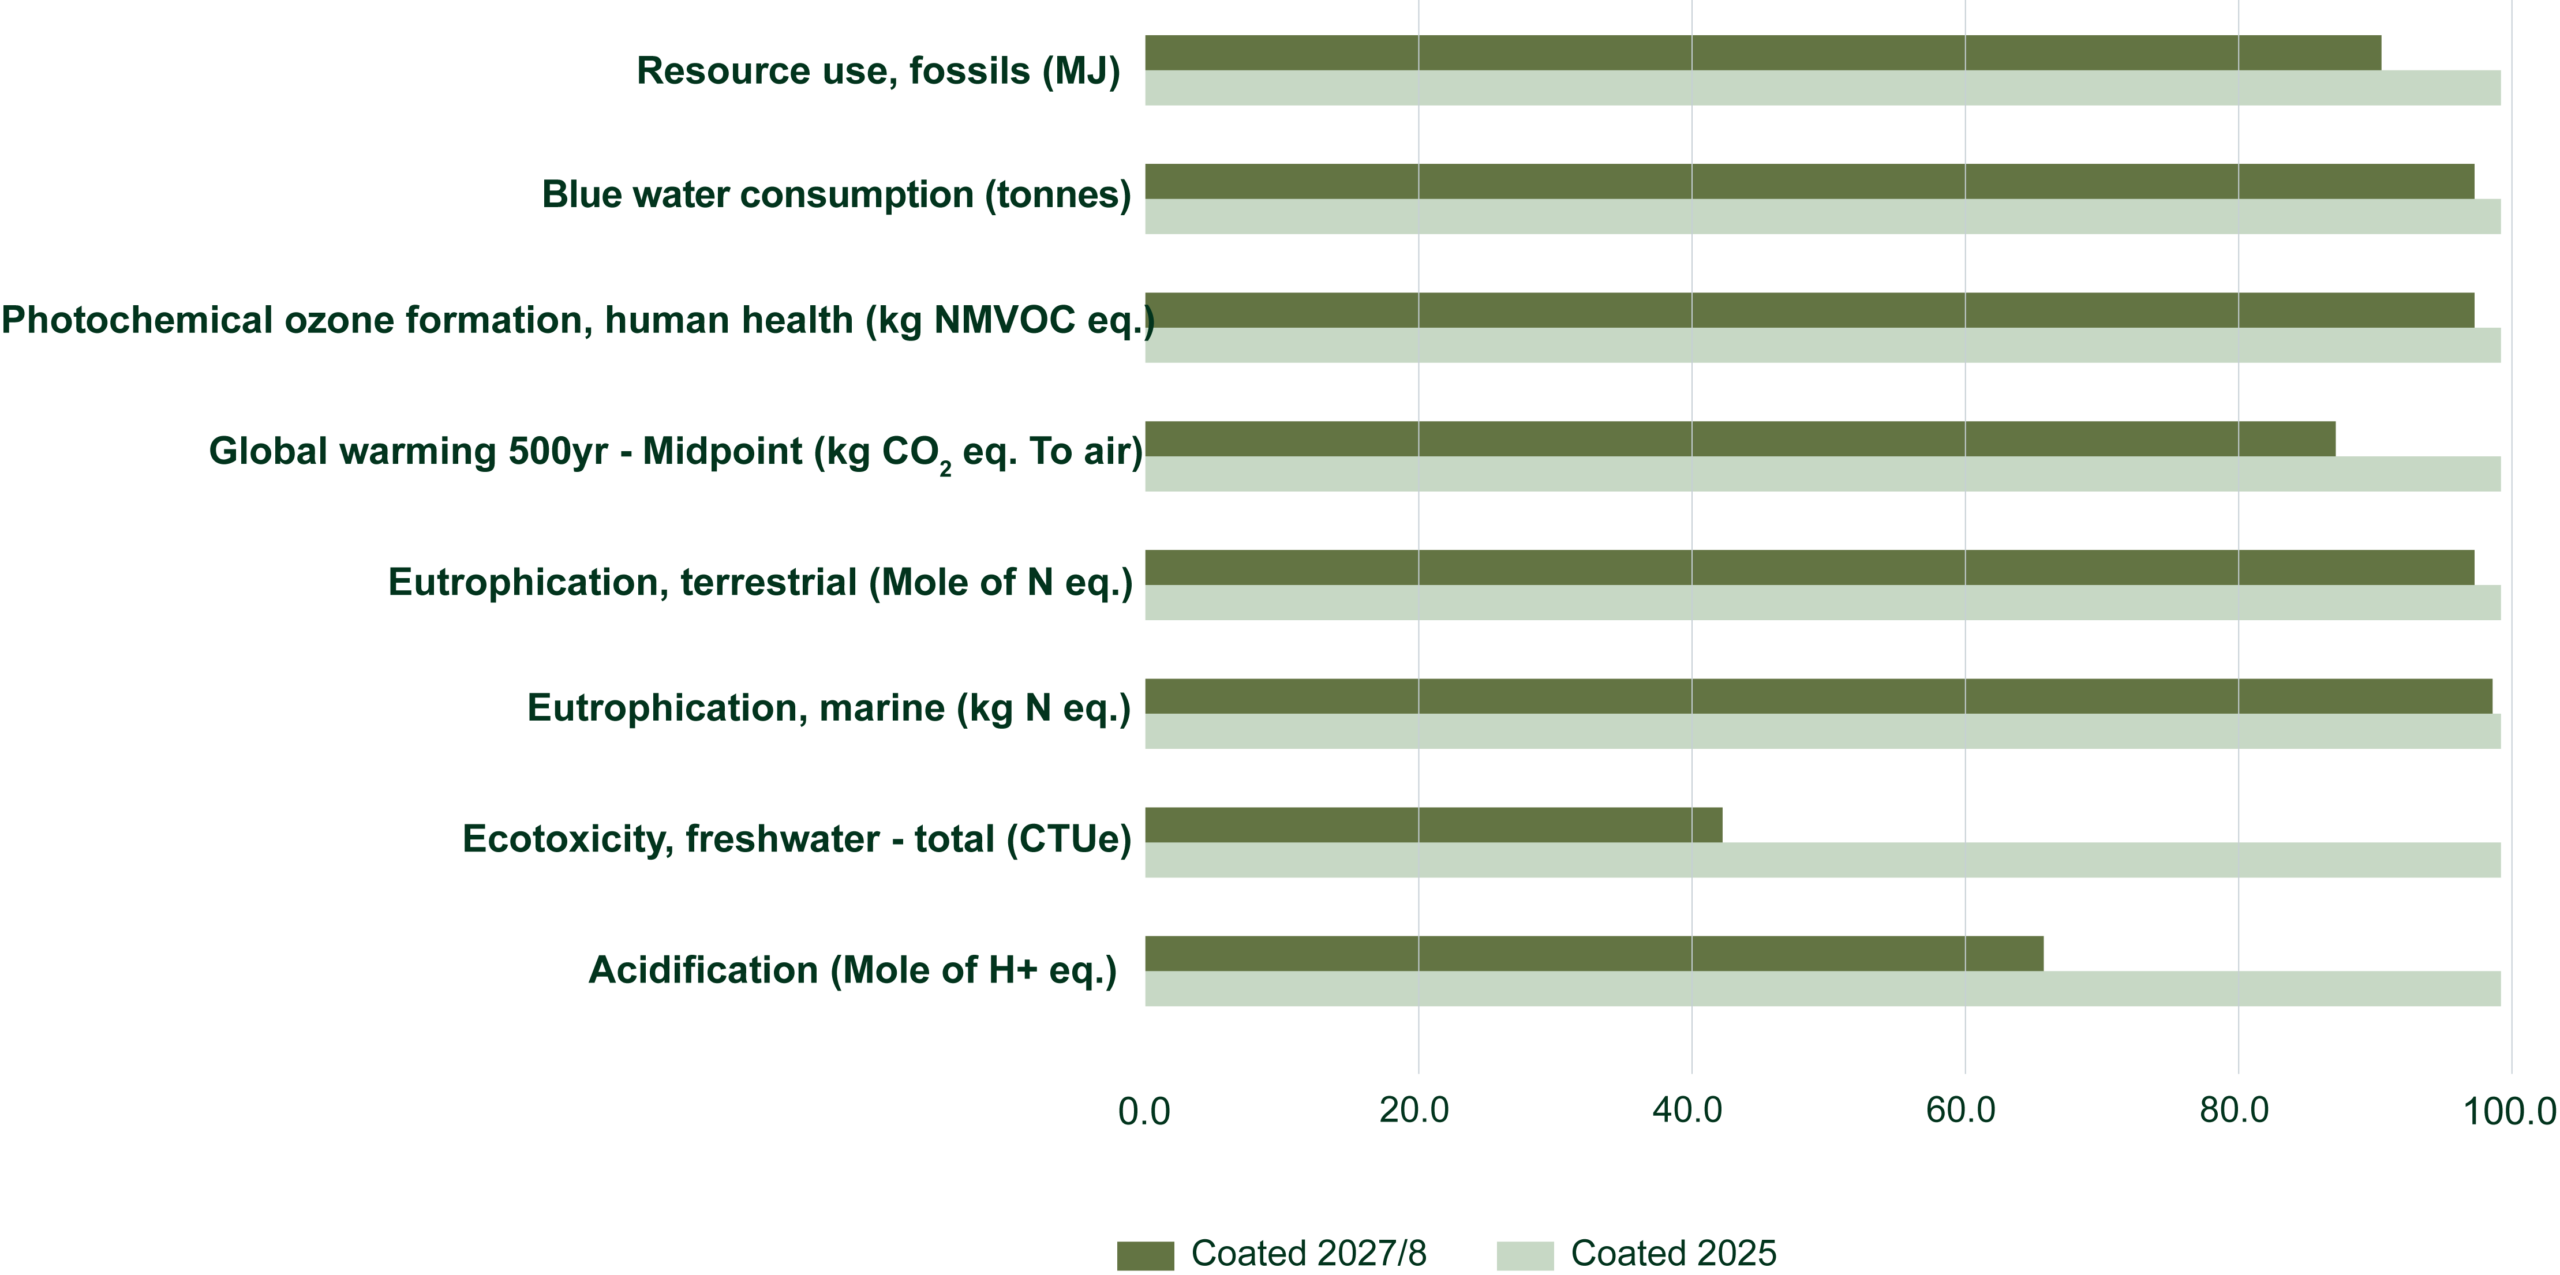
While the term ‘carbon footprint’ is now known to almost all of us, it is only one of a number of key environmental indicators that can be measured by way of LCA. It is not possible to compare all of the environmental impacts since our first LCA due to the fact that some of the results have changed significantly caused by updates to the databases. The graph below illustrates the projected improvements across multiple impact categories for our lacquered NatureFlex™ between now and 2027/28, driven by ongoing process improvements.
We are specifically committed to reducing our water consumption and have already made significant improvements such as upgrading our water treatment plant in 2019. This contributed to a sitewide water demand reduction of around 20% (≈500 m3/day).
Furthermore, Futamura sources wood pulp from eucalyptus trees, which does not require additional irrigation and the use of herbicides, insecticides and fertilisers are low to minimise environmental impacts. Additionally, Futamura’s UK and US operations hold FSC™ (Licence No. C119399) and PEFC (Licence No. PEFC/16-33-1610) chain of custody certification to ensure our wood pulp supports sustainable and responsible forestry.
Results for Lacquered NatureFlex™ based on PEF methods (EF 3.1) for all environmental indicators except for Global Warming, which was based on Impact 2002+.